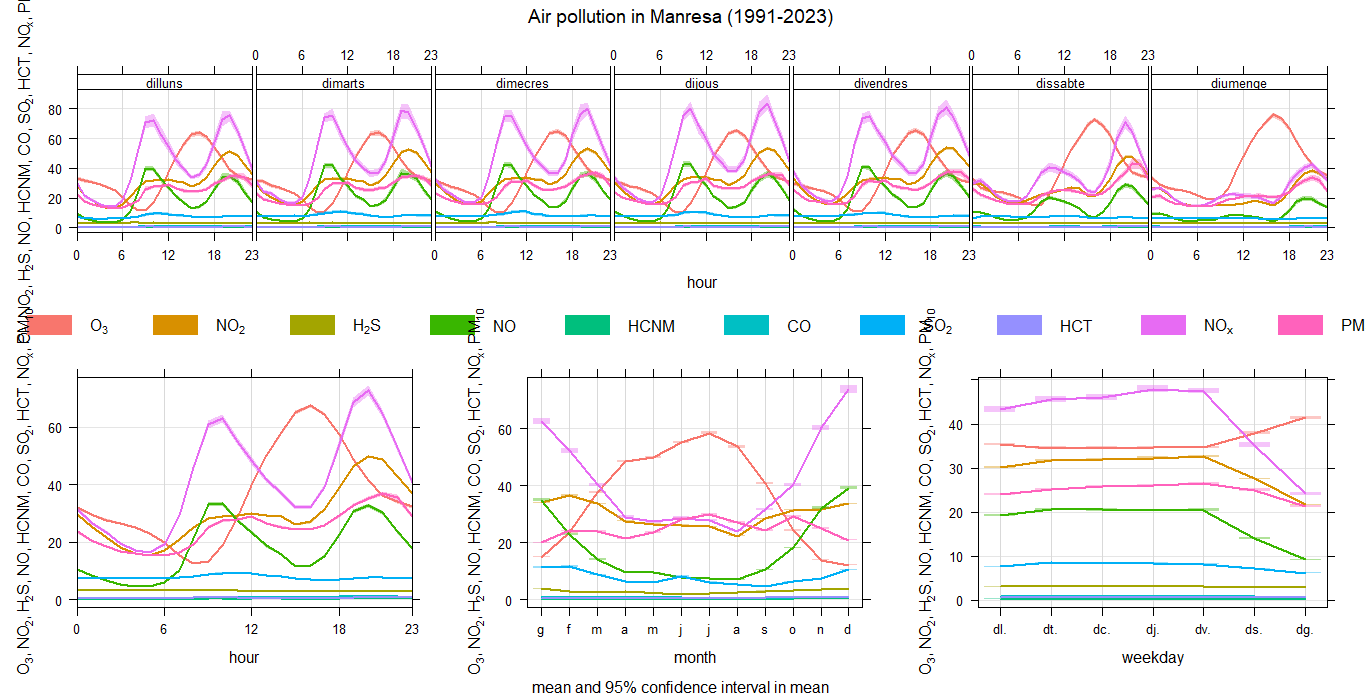
Here you can see the time variation of the air pollution from year 1991 to year 2023 in Manresa:
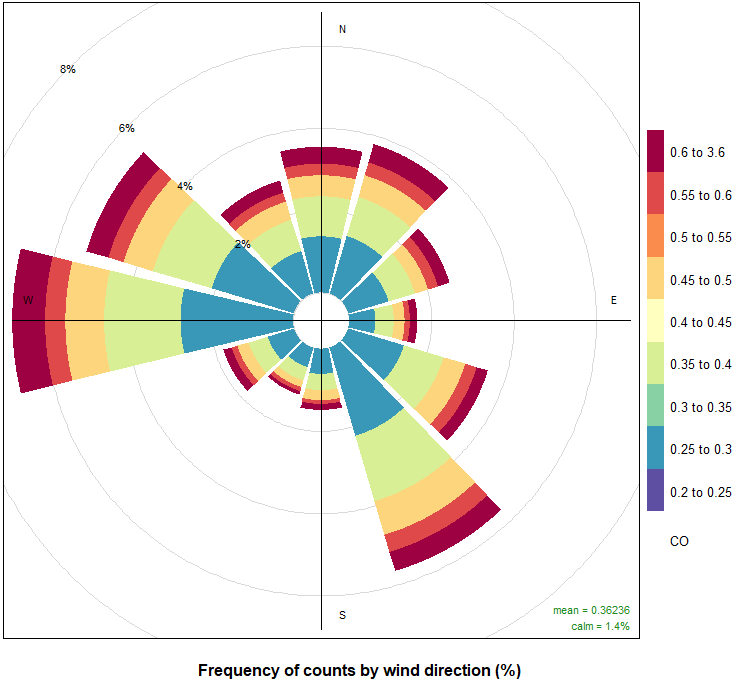
*The wind speed and wind direction data have been extracted from the nearest city with a Meteocat station, Òdena, due to the lack of this kind of station in Manresa.
**All of the units in the graphics represented are µg/m3.
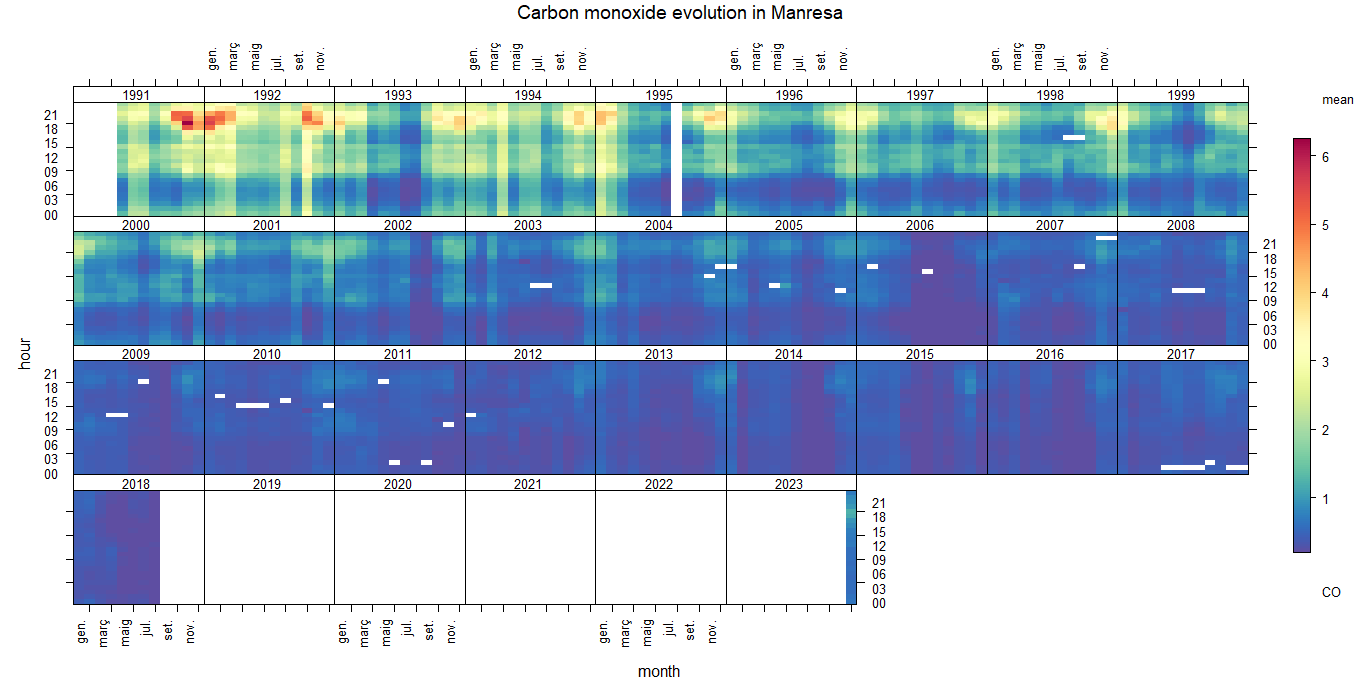
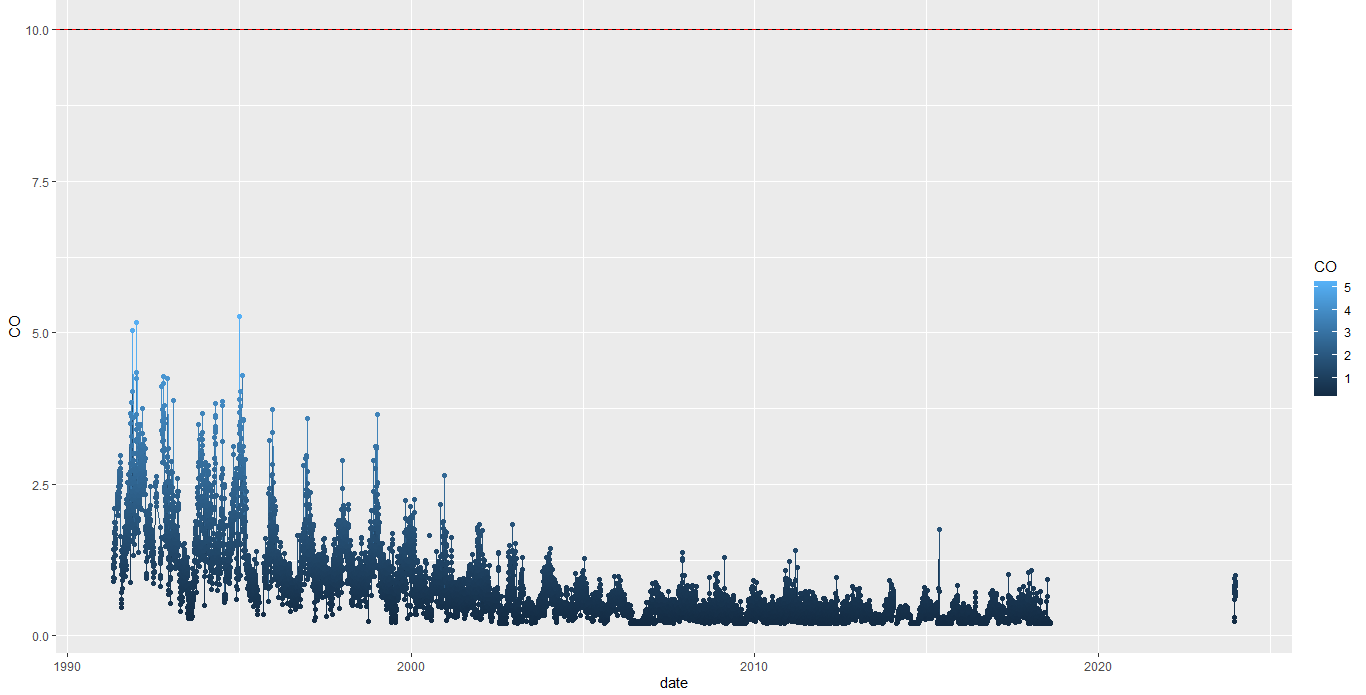
According to the graphics, carbon monoxide levels have significantly decreased (from 4-5-6 to 1-2-3) since 1991 to 2018 (the last year we have data of). As lots of other pollutants, CO's peak levels are at evening and in winter months. The amount of carbon monoxide has never surpassed the EU's and WHO's health limits, its higher levels are around 5 and the maximum is 10.
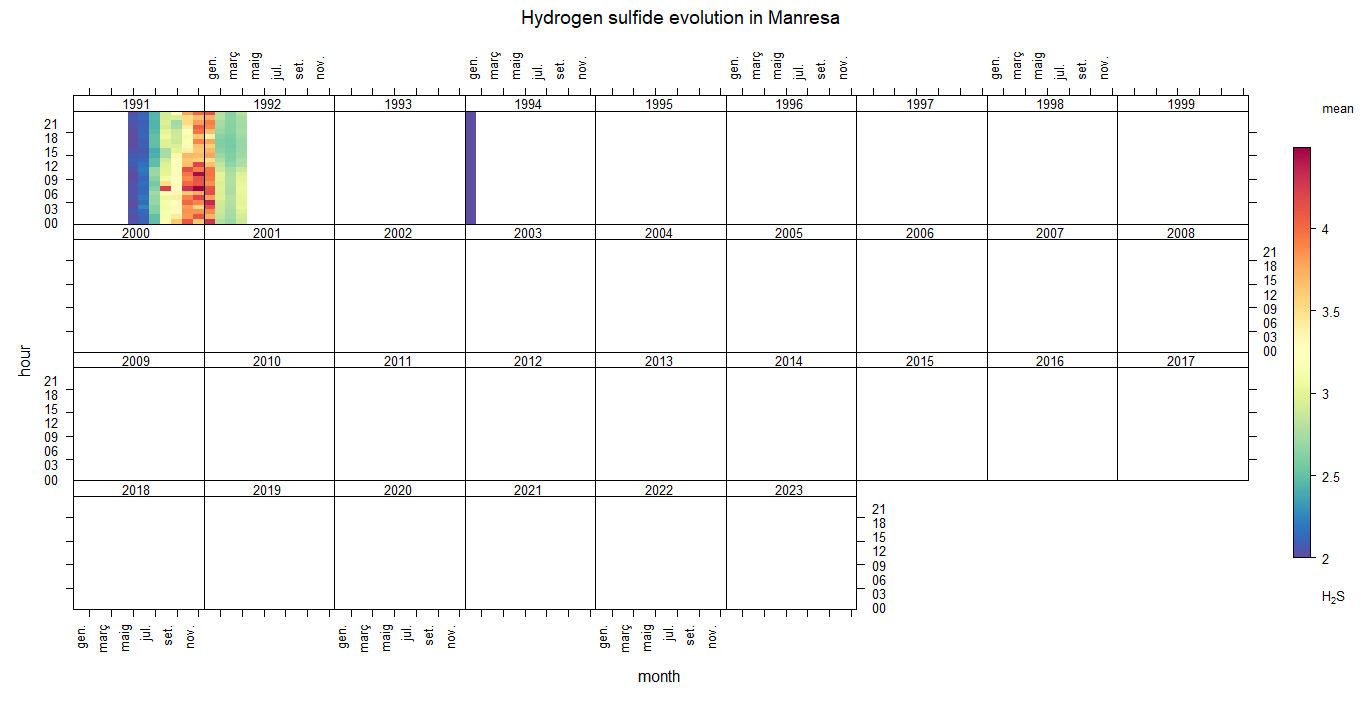
There is almost no data of this pollutant, the most we can say is that the levels of hydrogen sulfide were very high in late 1991, catching levels of 4 and almost 5 (µg/m3); the hour of the day doesn't affect very much but there's a clear difference between the hot season and the winter, with the amount of H2S in winter being the highest by far.
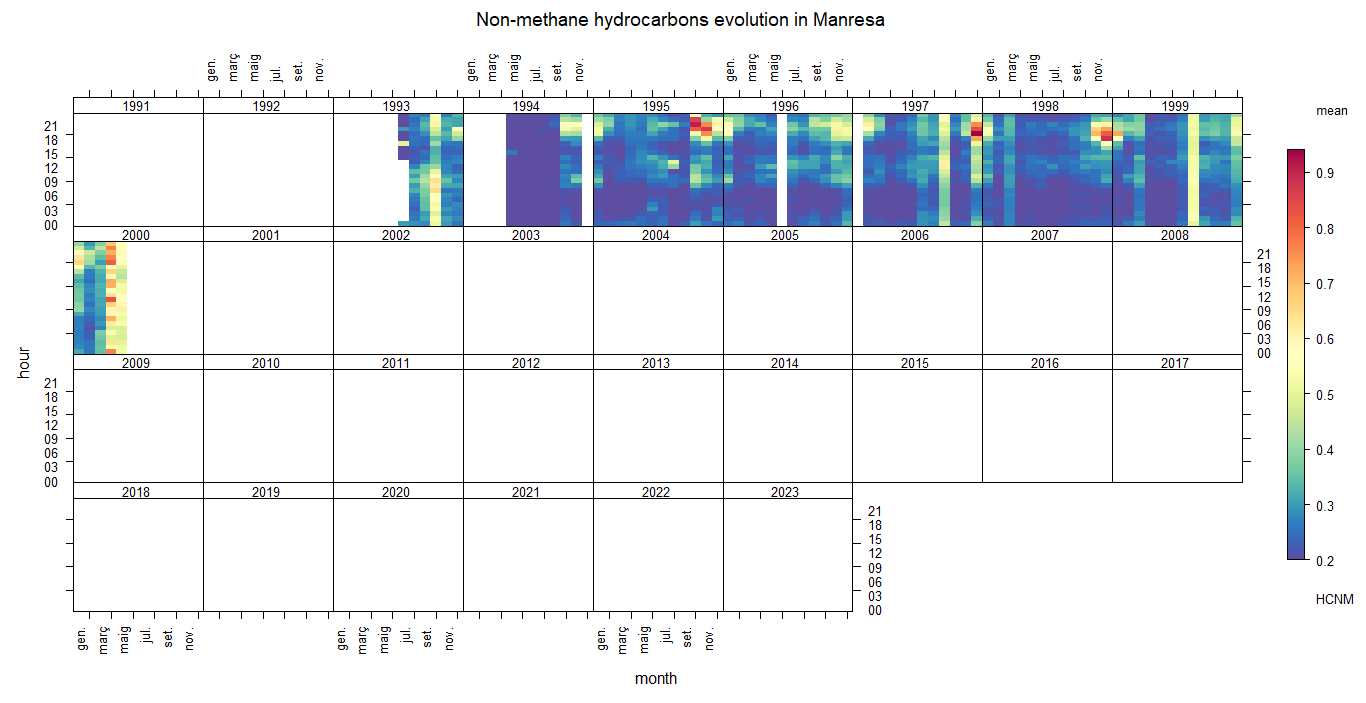
Non-methane hydrocarbons were only measured between the second half of 1993 and the first half of 2000, and there's no lots of data even between those years. Manresa had had generally low levels of HCNM, but there is some peaks in the December evenings of 1995, 1997 & 1998 where the amount of HCNM reaches almost 1. It's clear that in 2000 it started increasing significantly, so we can deduce it was a potential reason to stop measuring this type of pollutant.
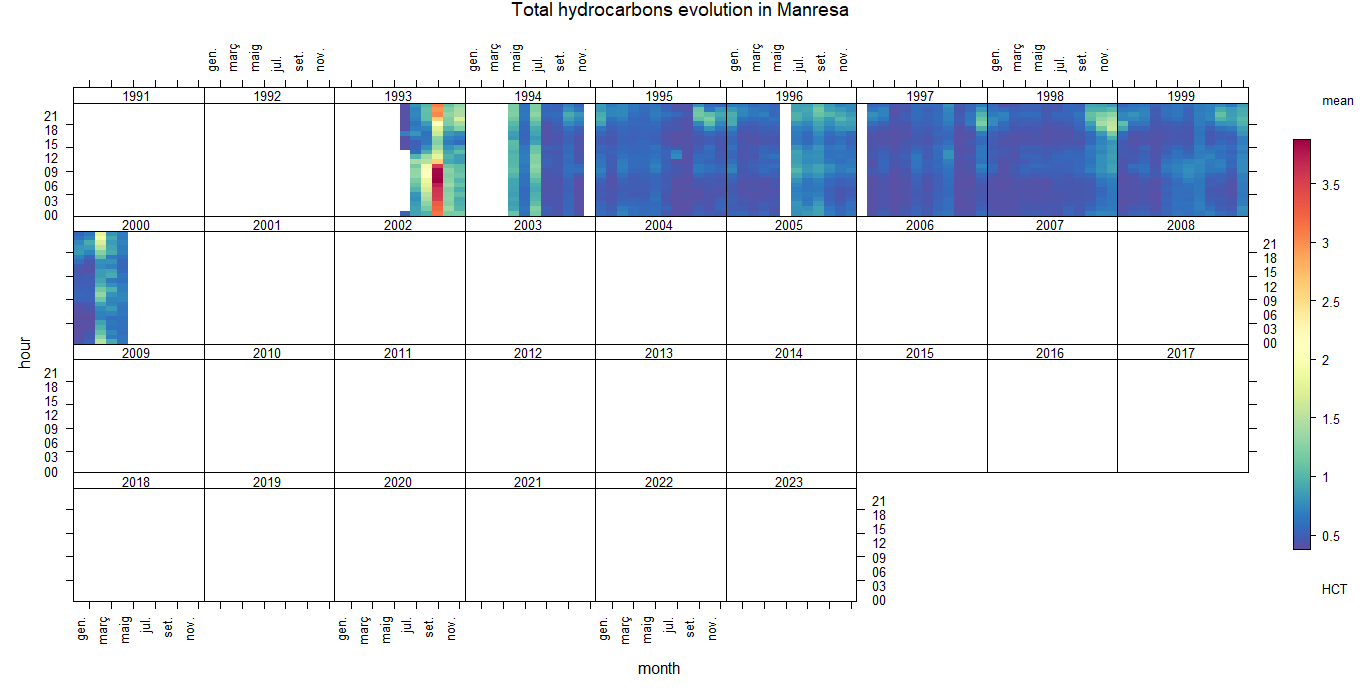
It's a very similar situation as the HCNM, because, like the other pollutant, total hydrocarbons were measured from 1993 to 2000, and the study of them started and ended exactly in the same months. Although the similarity between them, the highest levels of total hydrocarbons were at the beginning of the measurement, in 1993's autumn, with its peak hours being early in the mornings and late at nights, between 00:00 and 09:00. In these times there was almost 4 µg/m3 of HCT.
With the coincidence of stopping the measurement of HCT and HCNM we can conclude that it was a EU's decision and it had nothing to do with the increase of the amount of pollutant, because in the HCT case there's no correlation.
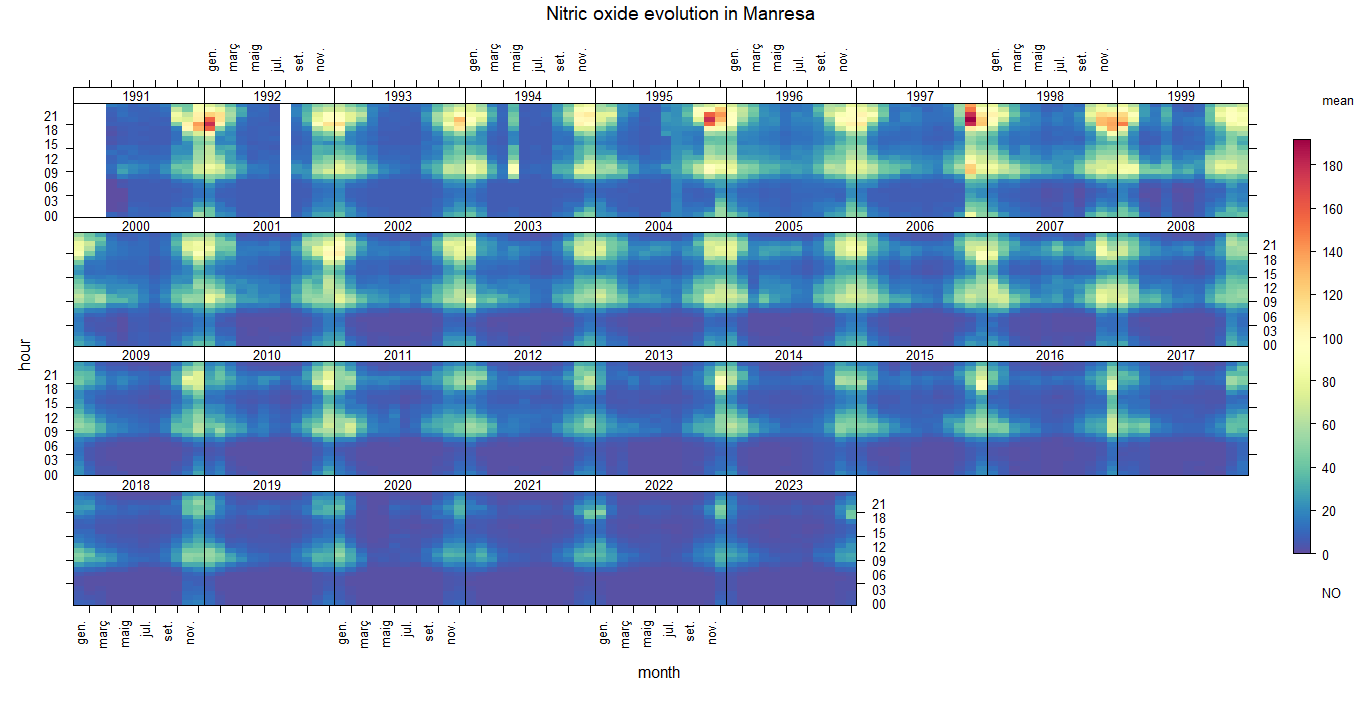
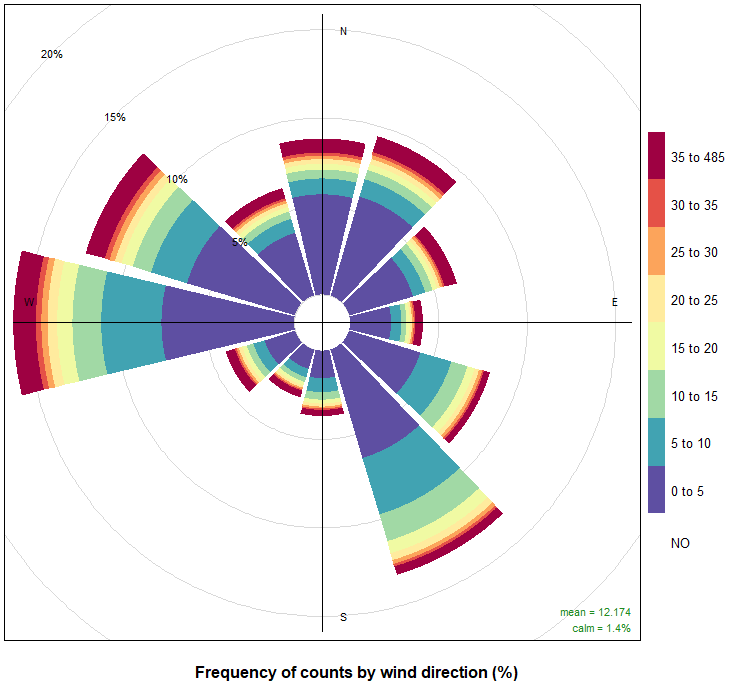
According to the graphics, the levels of NO in the atmosphere have progressively decreased from 1991 to nowadays, going from 60-100 in the 90s to 0-40 today (in the most polluted hours, which were from 09:00 to 21:00 in winter). As exceptions, we had three remarkable peaks of NO in Manresa: December 1991 - January 1992, October - November 1995 and October - November of 1997, reaching amounts up to 180.
The NO is caused by the combustion of fossil fuels, so that can explain why the most-pollution seasons are when its colder.
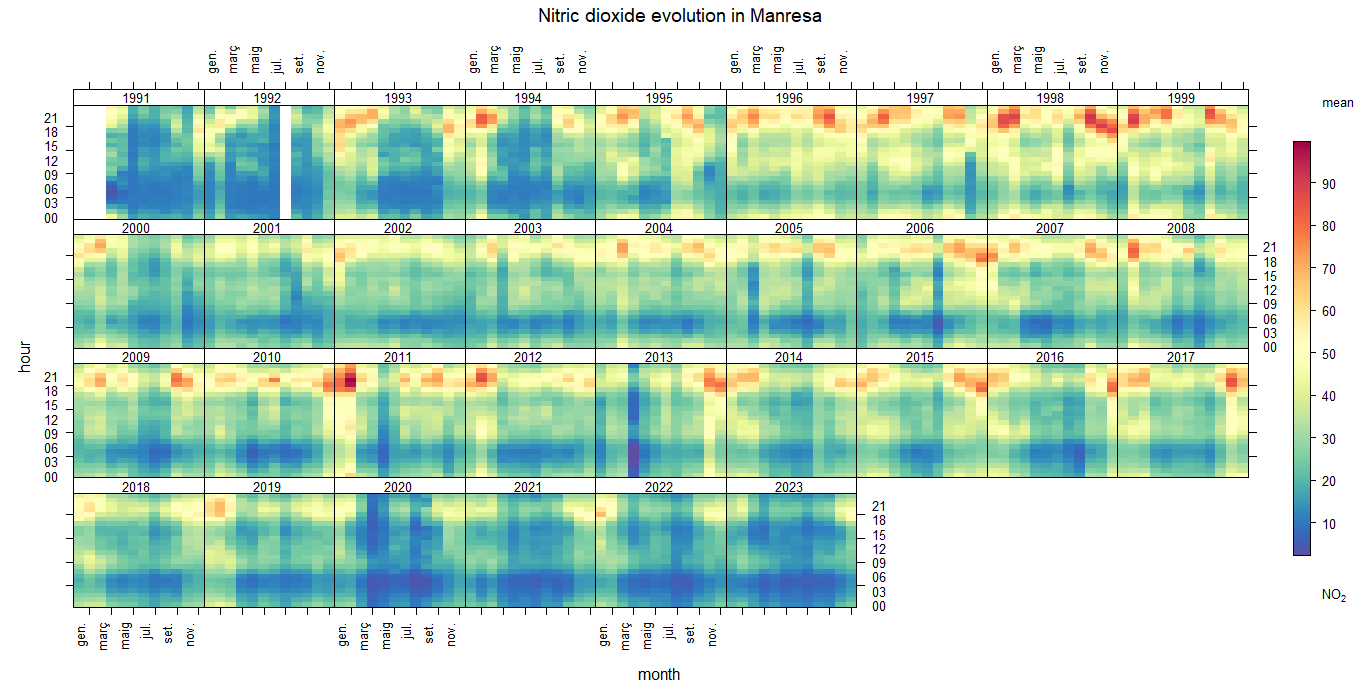
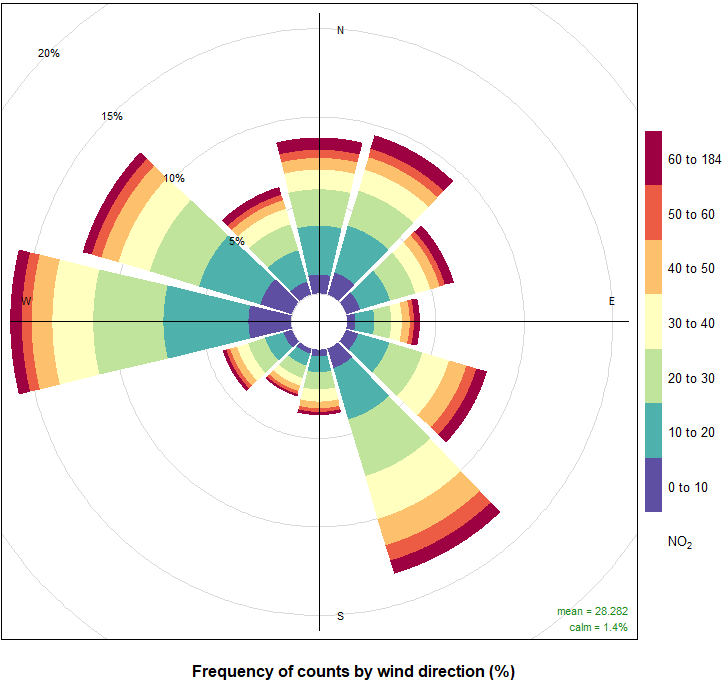
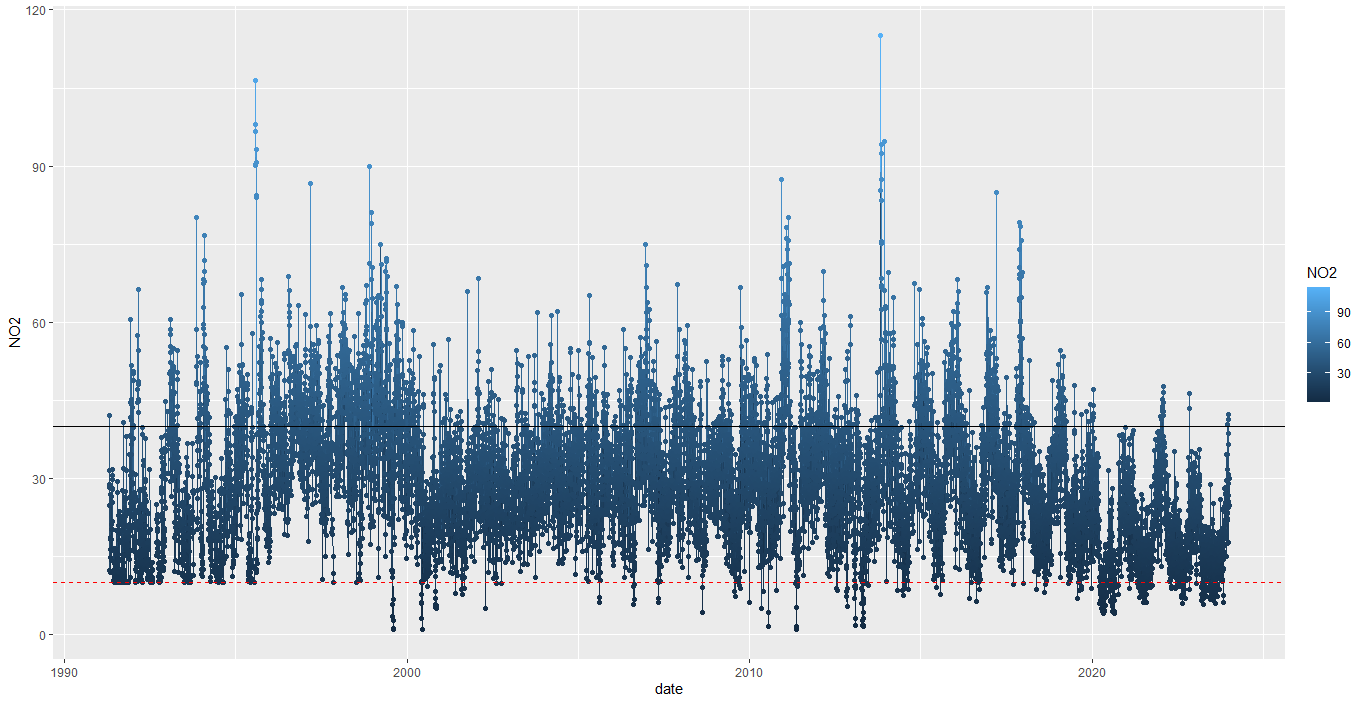
As graphics show, the levels of NO2 have decreased throughout the years, and its peak was in the 90s (1998, mainly). Although it had went down next years, we can clearly determine an important increase in late 2010 - early 2011. The hours with more pollution were at late in the afternoons and mostly in the evenings. The levels of NO2 widely surpass the recommendation limits of the WHO and the EU some times, being the EU's limit 40 and the WHO's 10.
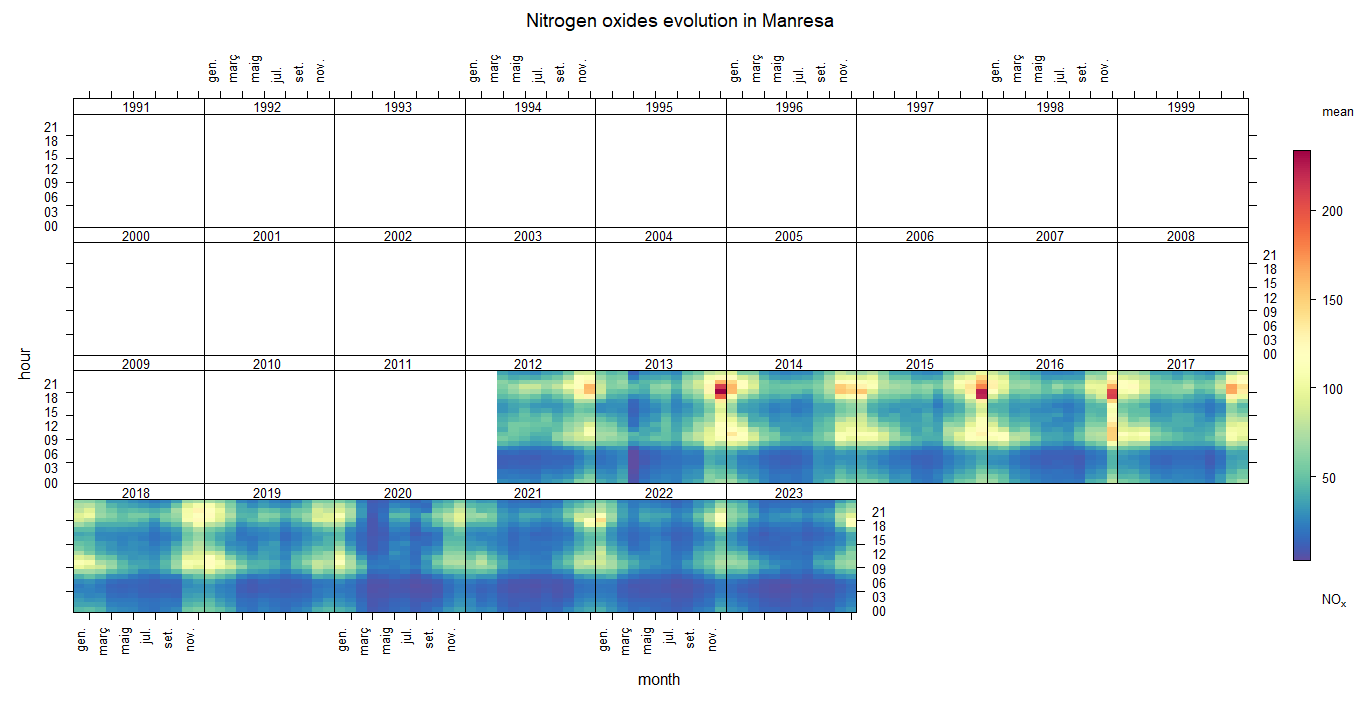
The NOX data start at 2012, so we don't have data of the 90s and the 2000s. The levels of NO in the atmosphere have slightly decreased since 2012, oing from 100-150 (closer to 150) to 100-150 (closer to 100) today (in the most polluted hours, which were from 09:00 to 21:00 in winter). As exceptions, we had three remarkable peaks of NOX in Manresa: Decembers of 2013, 2015 and 2017, reaching amounts up to 200.
Just as the NO, the NOX is caused by the combustion of fossil fuels, so that can explain why the most-pollution seasons are when its colder.
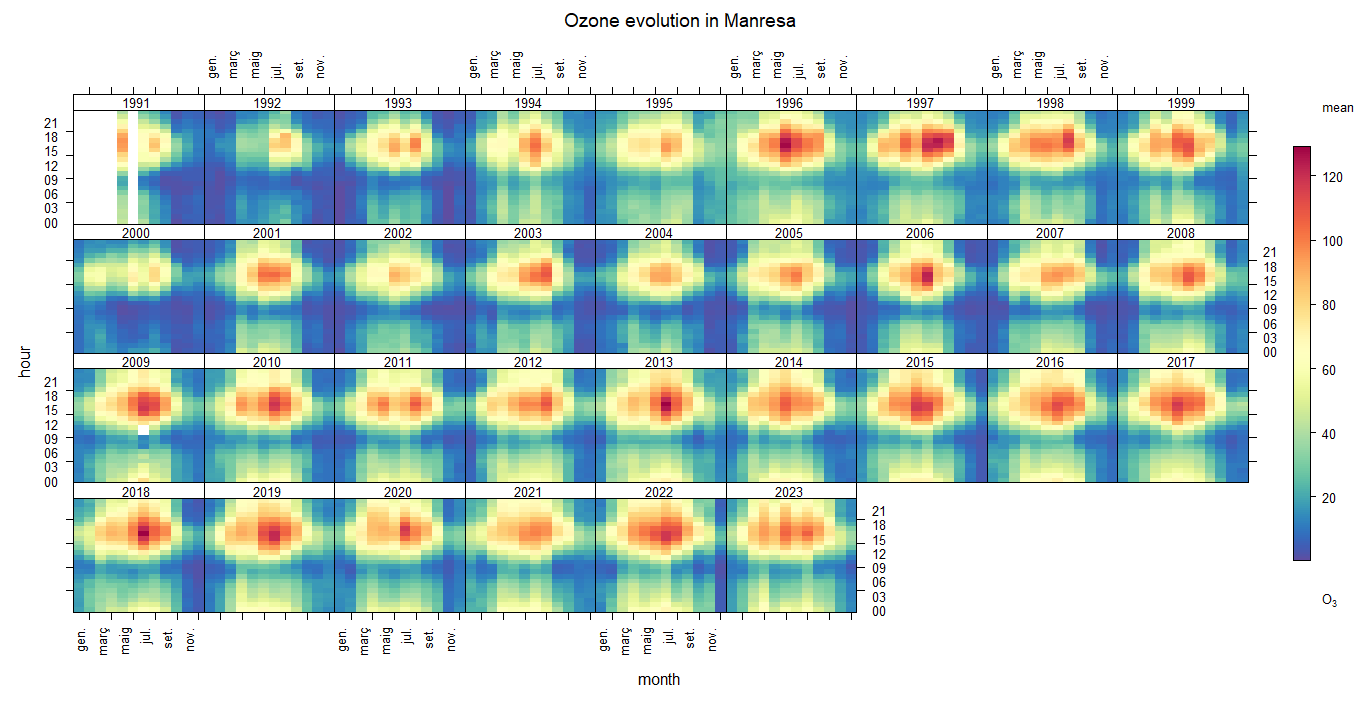
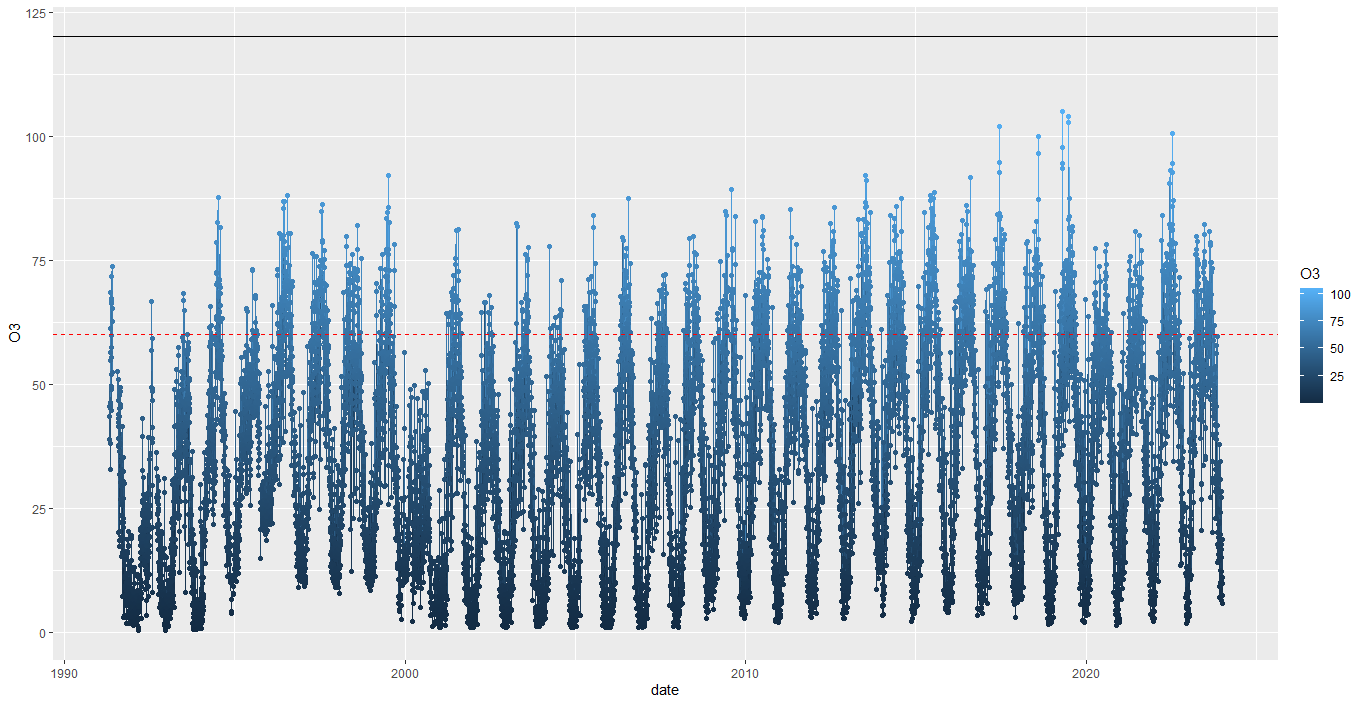
This pollutant is a bit more special, because it works the opposite way that nitrogen oxides work. This means that, for example, when NO decreases, ozone increases. Knowing this, we can aprreciate in the first graph that ozone has had similar amounts all over the years, since 1991 (obviously with its variations, but not as progressive as other pollutants, more like ups and downs). The peak levels of ozone have been registrated in the afternoons of the hottest months, such as June, July & August, with amounts up to 120 in its most-pollution days. Ozone follows a very clear pattern, and has surpassed lots of times the EU's and WHO's limits.
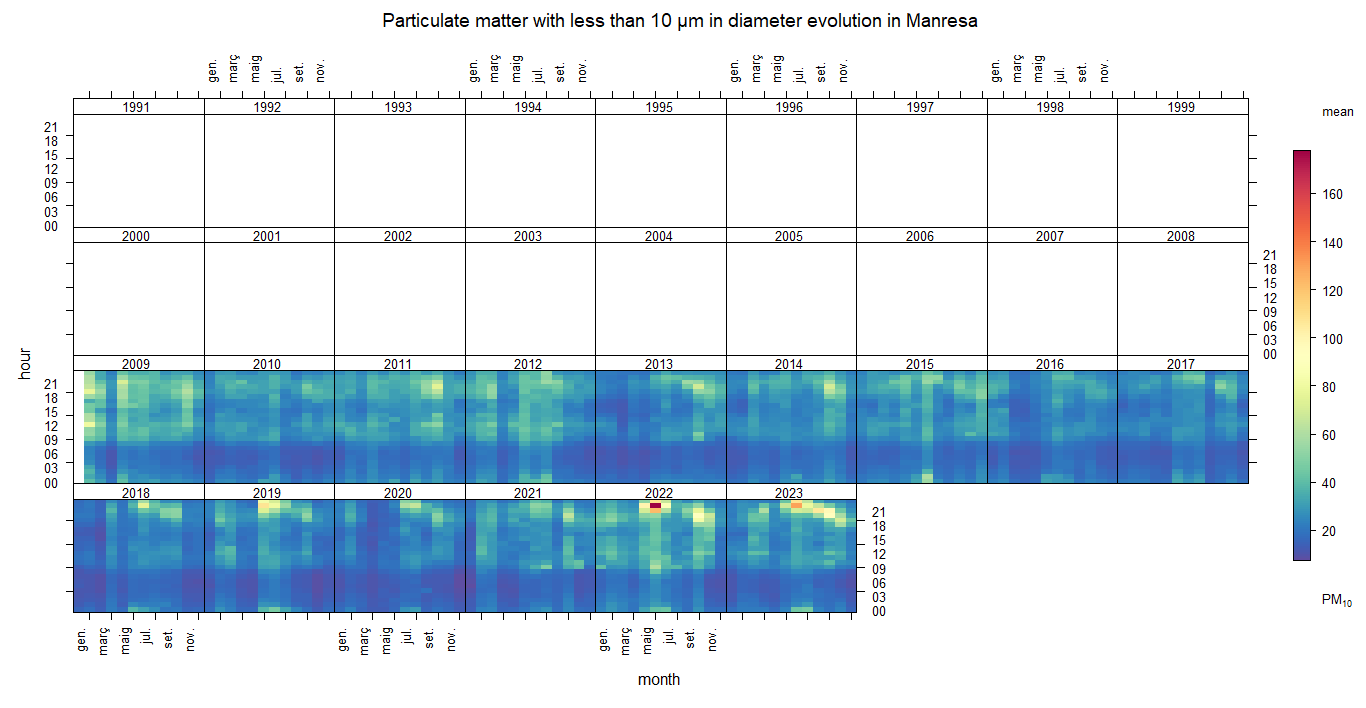
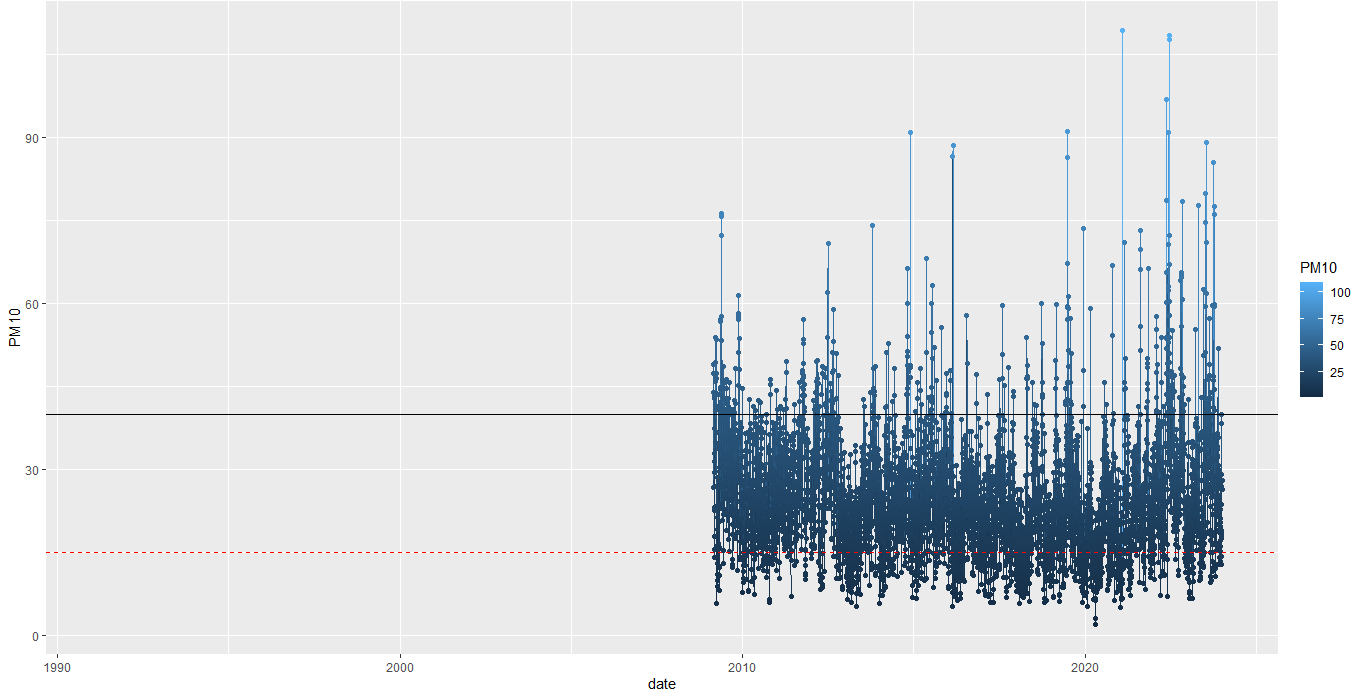
The amount of PM10 started being measured at the beginning of 2009, so there's not as many data as other pollutants have. Even with this handicap, there's still some conclusions which can be made. This last couple of years, opposite to NO2, the levels of PM10 in the atmosphere have increased. Together with the majority of pollutants, the most-pollution hours are in the evenings. It also exceeds the recomendation limits of the WHO and the EU some times, being the EU's limit 40 and the WHO's 15.
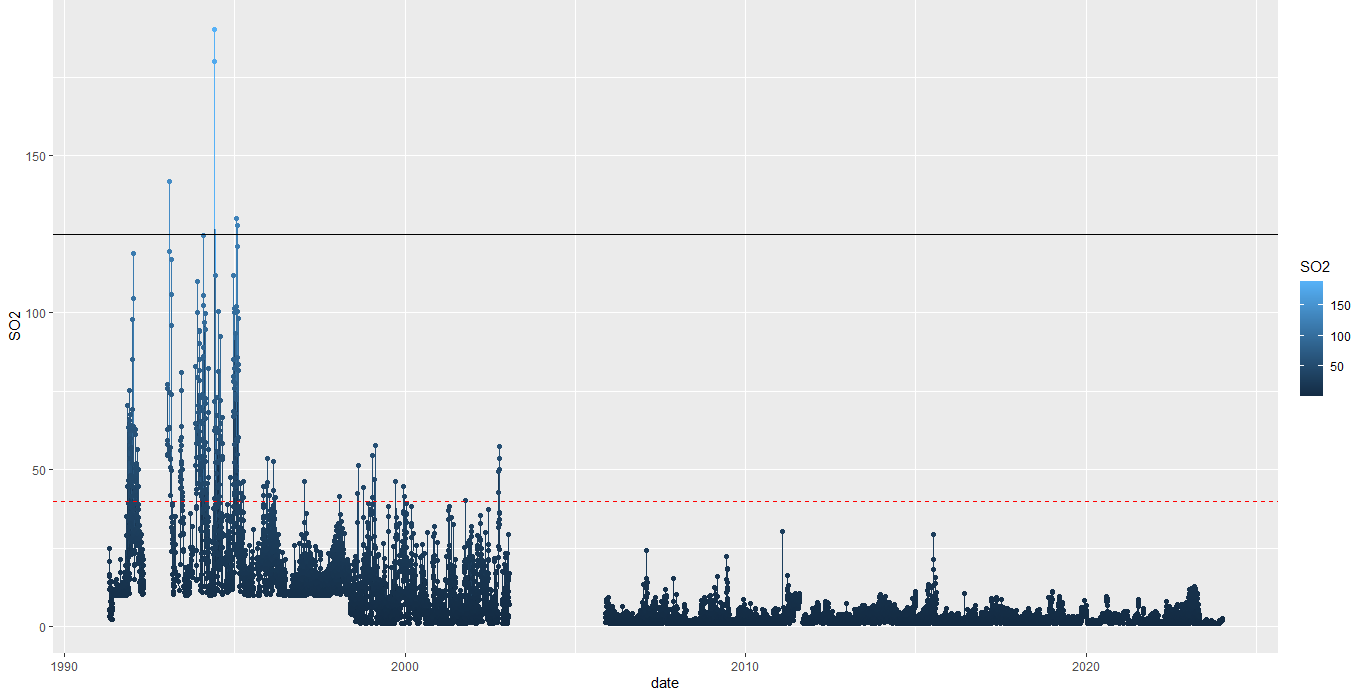
The sulfur dioxide levels have significantly decreased all over the years (although there's no data from 2003 to 2005). The most- pollution years were 1993 and 1994, and, just as lots of other pollutants, in winter. The highest levels of SO2 have gone up to 100 in those years while nowadays it doesn't pass 20. In its peak years, it surpassed the EU's and WHO's limit by far, with very pronunciated increases.
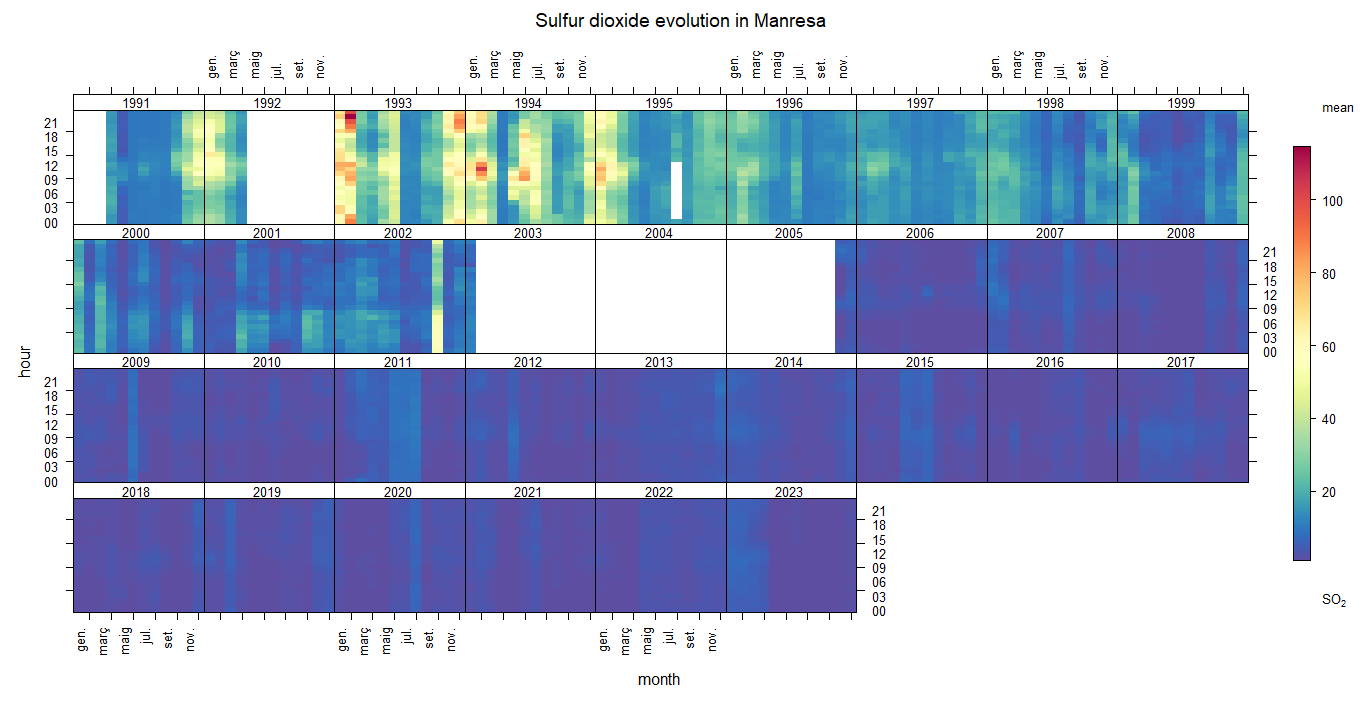
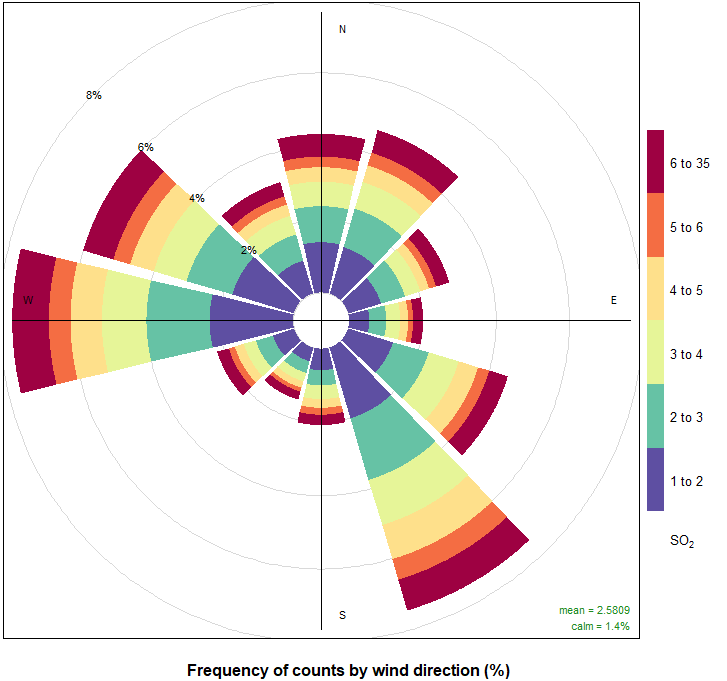
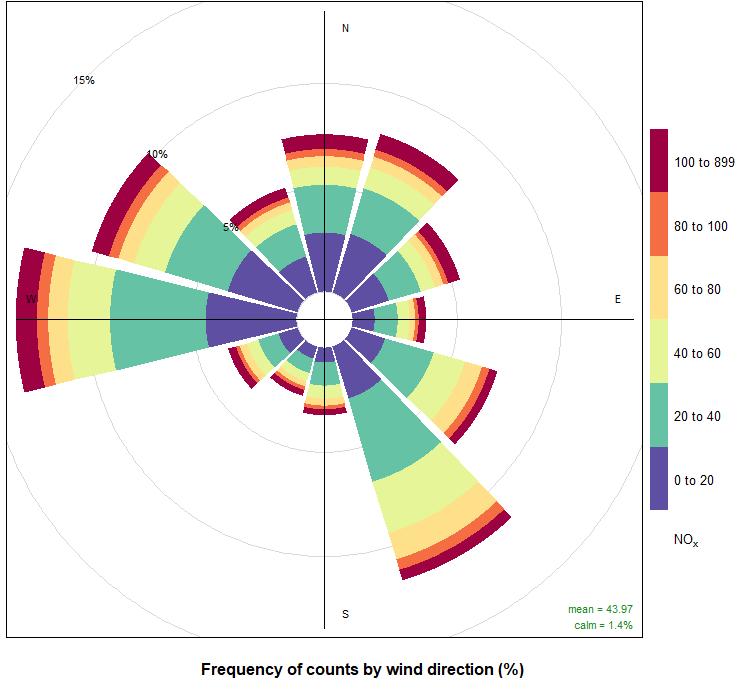
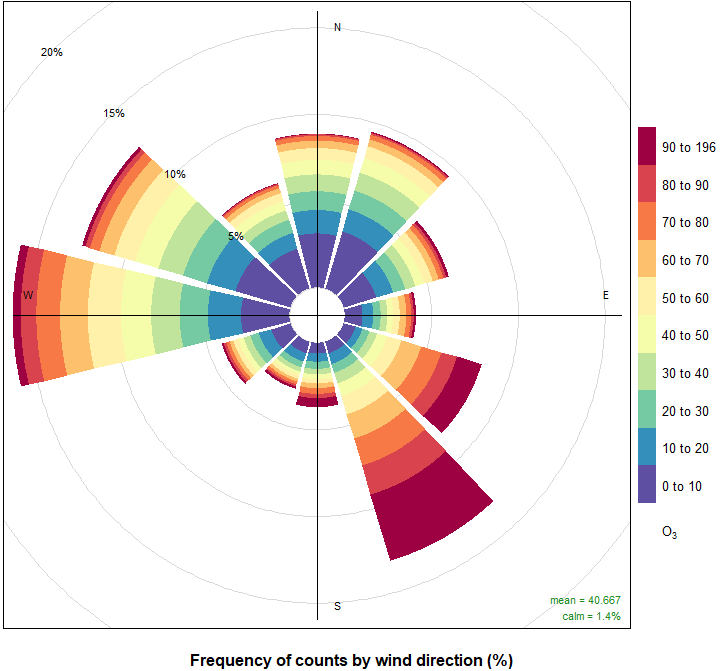
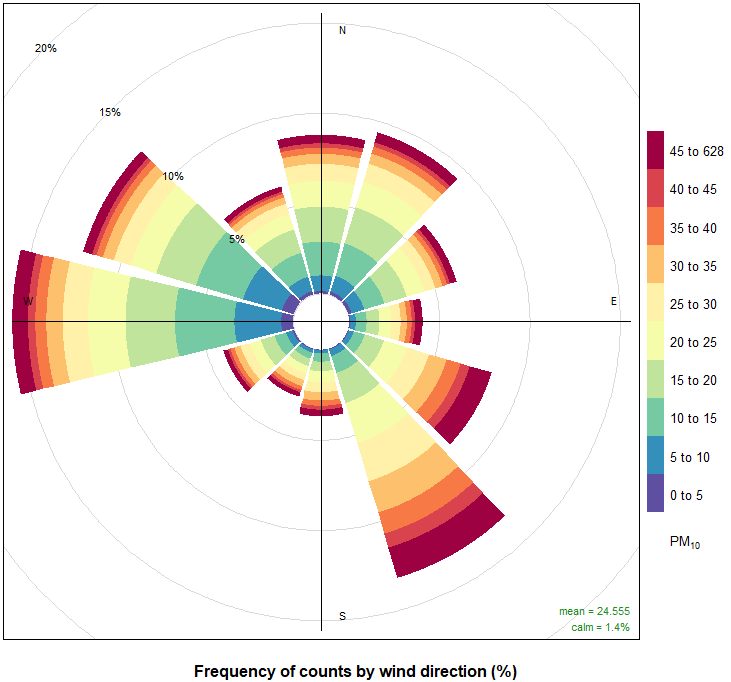
In general, the most-pollution hours are around evenings, and the season which nhas the highest levels of pollution is winter, what makes sense because it's colder and we need more artificial energy to heat up ourselves, the water we use for hygiene... Furthermore, it's more difficult to go to the places we have to go by walking, so it's logic that we pick up more our cars and motorcycles which also increase pollution levels. Even with all of this, in most of the cases, the levels of pollution have decreased in an important quantity. This can be explained by the fact that nowadays, people are more concerned about global warming and the consequences of not being respectful to our environment. Another reason can be, for example, that our technology has exponentially evolved and today we have more eco-friendly machines and devices, although we are exploiting the natural resources of our planet. Speaking in terms of the pollution itself, we can see that the majority of it comes from the west and south-east side. The south-east pollution must come from Barcelona, because it is very overpopulated and there's lots of factories around the city which can emit this type of pollutants. Te principal point of pollution, the west, might come from Tàrrega because it has an industrial polygon and the Trepat factory, an farming machines factory.